アプリケーション
広がるExoid(ナノ粒子マルチアナライザー)の測定事例はこちらをクリック
DLS(動的光散乱法)より、高感度検出が実現

大きさの異なる2種類のポリスチレン粒子を混合して、ExoidとDLSで計測した結果です。 DLSでは260.4nmに1つのピークしか検出されませんが、Exoidでは220、380nmにピークを検出できており、高感度なサイズ分布検出を実現しました。
関連文献
“Characterization of a Nanoparticulate Drug Delivery System Using Scanning Ion Occlusion Sensing”
Lin Yang, Murray F. Broom and Ian G. Tucker.
Pharmaceutical Research, DOI: 10.1007/s11095-012-0788-3,
Published Online: May 26, (2012).
<Abstract>
Purpose: To explore the application of scanning ion occlusion sensing (SIOS) as a novel technology for characterization of nanoparticles.
Methods: Liposomes were employed as model nanoparticles. The size distribution of the liposomes was measured by both SIOS and dynamic light scattering (DLS). Particle number concentration was determined based on particle translocation rate. The ability of SIOS and DLS to resolve bimodal samples was evaluated by measuring a mixture of 217 and 355 nm standard nanoparticles. Opsonization of liposomes by plasma was also studied using SIOS.
Results: SIOS was shown to measure the size of different liposomes with higher sensitivity than DLS and it requires a smaller sample volume than DLS. With appropriate calibration, SIOS could be used to determine particle number concentrations. In comparison, SIOS analysis of the mixture showed accurate resolution of the population as a bimodal distribution over a wide range of number ratios of the particles. SIOS could detect plasma opsonization of liposomes by demonstrating a increase in particle size and also changes in the particle translocation rate.
Conclusion: SIOS is a useful technology for nanoparticle characterization. It shows some advantages over DLS and is clearly a useful tool for the study of nanoparticle drug delivery systems. KEY WORDS: DLS – liposomes – nanoparticles – opsonization – SIOS
光学測定法と比較して、TEMと高い相関性

220、330、410nmのポリスチレンパーティクルを異なる測定手法で計測し比較した事例です。
上図左は3種類をそれぞれ個別に、上図右は混合して計測しています。
ExoidやDCSはTEMの計測結果との相関が非常に高いことがわかります。一方、光散乱法を採用したDLS、PTAでは実際とは異なる、ブロードなサイズ分布しか得ることができません。
様々な形状が混在する試料、光学特性(屈折率、色)が異なる試料など、他の測定手法では困難だった試料でも高精度なサイズ測定を実現しました。
関連文献
“A comparative study of submicron particle sizing platforms: Accuracy, precision and resolution analysis of polydisperse particle size distributions.”
Will Anderson, Darby Kozak, Victoria A. Coleman, Åsa K. Jämting, Matt Trau
J Colloid Interface Sci. 2013 Sep 1:405:322-30.
<Abstract>
The particle size distribution (PSD) of a polydisperse or multimodal system can often be difficult to obtain due to the inherent limitations in established measurement techniques. For this reason, the resolution, accuracy and precision of three new and one established, commercially available and fundamentally different particle size analysis platforms were compared by measuring both individual and a mixed sample of monodisperse, sub-micron (220, 330, and 410 nm – nominal modal size) polystyrene particles. The platforms compared were the qNano Tunable Resistive Pulse Sensor, Nanosight LM10 Particle Tracking Analysis System, the CPS Instruments’s UHR24000 Disc Centrifuge, and the routinely used Malvern Zetasizer Nano ZS Dynamic Light Scattering system. All measurements were subjected to a peak detection algorithm so that the detected particle populations could be compared to ‘reference’ Transmission Electron Microscope measurements of the individual particle samples. Only the Tunable Resistive Pulse Sensor and Disc Centrifuge platforms provided the resolution required to resolve all three particle populations present in the mixed ‘multimodal’ particle sample. In contrast, the light scattering based Particle Tracking Analysis and Dynamic Light Scattering platforms were only able to detect a single population of particles corresponding to either the largest (410 nm) or smallest (220 nm) particles in the multimodal sample, respectively. When the particle sets were measured separately (monomodal) each platform was able to resolve and accurately obtain a mean particle size within 10% of the Transmission Electron Microscope reference values. However, the broadness of the PSD measured in the monomodal samples deviated greatly, with coefficients of variation being ∼2–6-fold larger than the TEM measurements across all four platforms. The large variation in the PSDs obtained from these four, fundamentally different platforms, indicates that great care must still be taken in the analysis of samples known to have complex PSDs. All of the platforms were found to have high precision, i.e. they gave rise to less than 5% variance in PSD shape descriptors over the replicate measurements.
再現性高く定量濃度評価
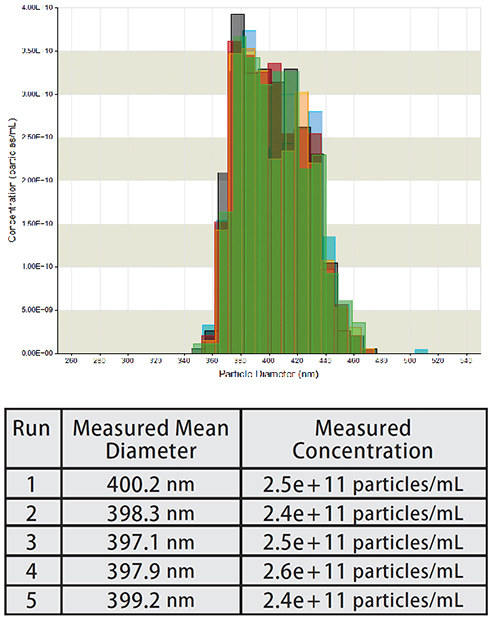
Certificated Mean Diameter 400nm のNIST 標準粒子(ポリスチレン)をTRISバッファーに1000倍希釈したサンプルを5度に渡りExoidで測定し、再現性が得られるかを検証したデータです。
【測定条件】
NP200使用(推奨測定範囲100nm-400nm)、 Voltage: 0.46V/Stretch: 45.42mm/
Pressure 9で測定
リポソームの凝集をサイズ分布と濃度で定量化
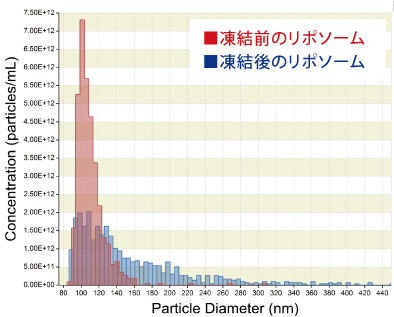
粒子濃度の定量化
左のグラフではリポソームの凍結による安定性を評価したグラフです。 凍結後は凝集により、リポソームのサイズが大きくなり、濃度が減少しています。 Exoidでは高分解能なサイズ分布と濃度の定量化により、凝集解析を行うことが可能です。

d90/d10計量は、サンプルの粒径分布の尺度。値が1に近いほど、単分散であることを示しています。 単分散であったリポソームは、凍結によってアグリゲーション量が増加し、多分散になっていることが分かります。
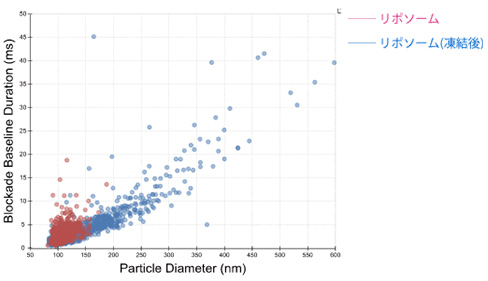
表面電荷(チャージ)変化量の計測
凍結したリポソームはサイズが大きくなるため、移行時間も長くなる(=チャージが弱い)ことから、リポソームが融合して大きくなるだけでなく、凝集(アグリゲーション)を起こしていることが分かります。 凍結前に比べ、粒子サイズは多分散化し、(=均一性がなくなり、品質としては低下していることが分かります。)
関連文献
“Tunable Pores for Measuring Concentrations of Synthetic and Biological Nanoparticle Dispersions.”
G. Seth Roberts, Sam Yu, Qinglu Zeng, Leslie C.L. Chan, Will Anderson, Aaron H. Colby, Mark W.
Grinstaff, Steven Reid, Robert Vogel.
Biosensors and Bioelectronics 31, p. 17-25, Jan 15 (2012).
<Abstract>
Scanning ion occlusion sensing (SIOS), a technique that uses a tunable pore to detect the passage of individual nano-scale objects, is applied here for the rapid, accurate and direct measurement of synthetic and biological nanoparticle concentrations. SIOS is able to characterize smaller particles than other direct count techniques such as flow cytometry or Coulter counters, and the direct count avoids approximations such as those necessary for turbidity measurements. Measurements in a model system of 210-710 nm diameter polystyrene particles demonstrate that the event frequency scales linearly with applied pressure and concentration, and that measured concentrations are independent of particle type and size. Both an external-calibration and a calibration-free measurement method are demonstrated. SIOS is then applied to measure concentrations of Baculovirus occlusion bodies, with a diameter of ~1 μm, and the marine photosynthetic cyanobacterium Prochlorococcus, with a diameter of ~600 nm. The determined concentrations agree well with results from counting with microscopy (a 17% difference between the mean concentrations) and flow cytometry (6% difference between the mean concentrations), respectively.
ナノ粒子の表面電荷を個別に計測
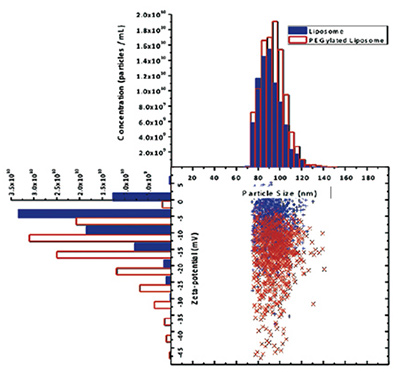
左のグラフはリポソームとPEG修飾リポソームの計測結果です。
右下の2Dグラフは横軸にサイズ、縦軸に表面チャージ量をゼータポテンシャルで定量化を示しています。
それぞれ、サイズとチャージ量別に濃度を算出することができます。
関連文献
“Simultaneous Size and ζ Potential Measurements of Individual Nanoparticles in Dispersion Using Size Tunable Pore Sensors.”
Kozak et al.
ACS Nano, Just Accepted Manuscript DOI: 10.1021 / nn3020322,
Published Online: July 18, (2012)
<Abstract>
The prospect of characterizing individual nanoparticles, molecules, or DNA base pairs has generated considerable interest in resistive pulse sensing. In addition to size and concentration analysis, this technique also has the capacity to measure the charge density of objects in situations where electrophoretic forces dominate their motion. Here we present a methodology to simultaneously extract, via appropriate theoretical models, the size and ζ-potential of objects from the resistive pulse signal they generate. The methodology was demonstrated using a size-tunable elastic pore sensor to measure a complex “bimodal” suspension composed of two particle sets with different size and charge. Elastically tuning the size of the pore sensor, by stretching the elastic pore membrane, enables a larger sample size range to be analyzed, improves measurement sensitivity, and fine-tunes the forces acting on objects. This methodology represents a new approach for investigating and understanding the fundamental behavior of nanoscale dispersions.
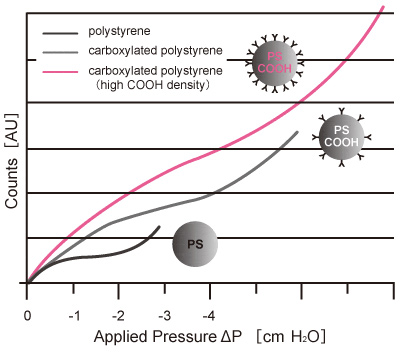
Exoidは自動圧力可変モジュール(APS)を使用して、粒子の表面電荷に関わる1次情報を測定可能です。
左図はVPMの圧力と粒子の電気泳動速度の関連を示しています。S字カーブの湾曲点は圧力と電荷のバランスがとれている点で粒子の表面電荷に相当します。
関連文献
“A variable pressure method for characterising nanoparticle surface charge using pore sensors.”
Robert Vogel, Will Anderson, James Eldridge, Ben Glossop, and Geoff Willmott.
Anal. Chem., 2012, 84 (7), pp 3125–3131 DOI: 10.1021 / ac2030915
Publication Date (Web): February 27, 2012
<Abstract>
A novel method using resistive pulse sensors for electrokinetic surface charge measurements of nanoparticles is presented. This method involves recording the particle blockade rate while the pressure applied across a pore sensor is varied. This applied pressure acts in a direction which opposes transport due to the combination of electro-osmosis, electrophoresis, and inherent pressure. The blockade rate reaches a minimum when the velocity of nanoparticles in the vicinity of the pore approaches zero, and the forces on typical nanoparticles are in equilibrium. The pressure applied at this minimum rate can be used to calculate the zeta potential of the nanoparticles. The efficacy of this variable pressure method was demonstrated for a range of carboxylated 200 nm polystyrene nanoparticles with different surface charge densities. Results were of the same order as phase analysis light scattering (PALS) measurements. Unlike PALS results, the sequence of increasing zeta potential for different particle types agreed with conductometric titration.
洗浄殺菌の新規DDSの開発に ナノバブル測定
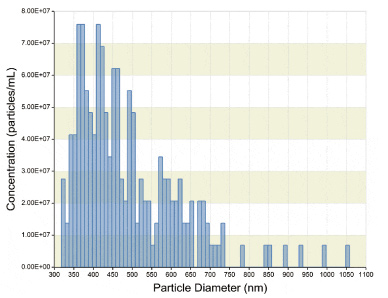
ナノバブルの分散状態と濃度を測定
1μm以下の微細な気泡のナノバブルは、気泡を形成しているガスの種類によって、殺菌効果や生理活性作用、DDSなど、今後の産業分野への応用が期待されています。
粒度分布が幅広いナノバブルですが、それらも正確に個数分布を取得する事が可能です。
迅速診断・疾病マーカーの開発に 細胞外小胞測定
細胞外小胞のサイズと濃度を定量化 【ユーザー測定事例】
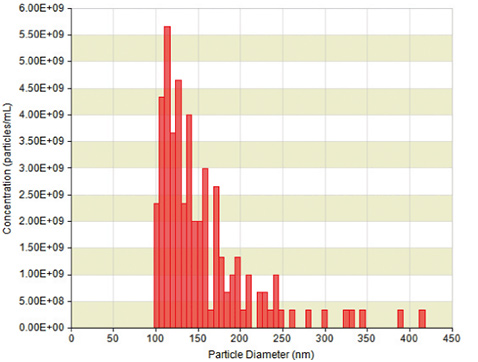
超遠心で回収した細胞外小胞や培地を計測してエクソソソームのサイズ分布と濃度を計測しています。
【資料御提供】
広島大学
大学院医歯薬学総合研究科 細胞分子生物学研究室
教授 田原 栄俊 様
細胞外小胞のサイズと濃度を定量化 【ユーザー測定事例】
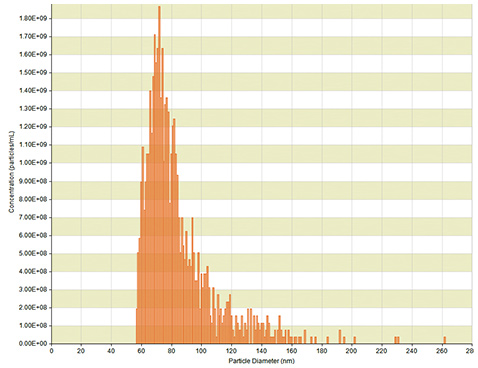
細胞外小胞診断デバイスの開発を目指し、Exoidを用いて細胞外小胞の濃度・粒径分布を計測した事例です。
左のグラフはヒト血清を110,000×g,70 minで超遠心した後に、220nmのフィルターにかけて抽出した細胞外小胞を計測した結果です。
【資料御提供】
東京大学
大学院工学系研究科 マテリアル工学専攻
教授 一木 隆範 様
尿中細胞外小胞の高精度サイズ分布を取得
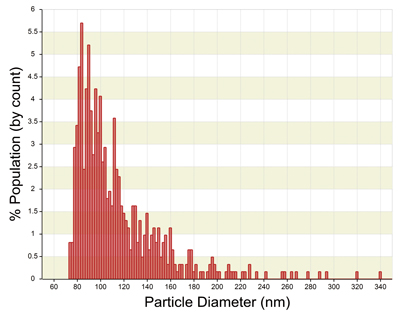
血液や尿、唾液等の体液中に存在する微小胞の細胞外小胞は体内の様々な部位から発生し、その疾病由来マーカーとして期待されています。
Exoidは様々な体液からその存在をサイズ分布と濃度、抗体反応で測定することができます。
関連文献
“Quantification of nanosized extracellular membrane vesicles with scanning ion occlusion sensing.”
Jeroen de Vrij, Sybren LN Maas, Malisa van Nispen, Miguel Sena-Esteves, Ronald WA Limpens,
Abraham J Koster, Sieger Leenstra, Martine L Lamfers, and Marike LD Broekman.
NANOMEDICINE, VOL. 8, NO. 9, 2013
<Abstract>
Background: Cells secrete different types of membrane vesicles (MVs), which may act as important entities in normal human physiology and in various pathological processes. The established methods for quantification of MVs require purification or preanalytical handling of samples with labeling moieties. Aim: The authors’ aim was to develop a method for high-throughput, labeling-free quantification of nonpurified MVs. Materials & methods: Scanning ion occlusion sensing technology, which relies on the detection of particles upon their movement through a nanopore, was investigated for the ability to quantify nanosized MVs (<400 nm) in bodily fluids and cell culture supernatants. Results: Scanning ion occlusion sensing allowed for rapid and easy measurement of the concentration of MVs in all biological fluids tested. Conclusion: Scanning ion occlusion sensing technology enables the quantification of MVs in biological samples without the requirement of MV isolation and/or labeling. This offers a highly valuable addition to the currently used repertoire of MV quantification methods.
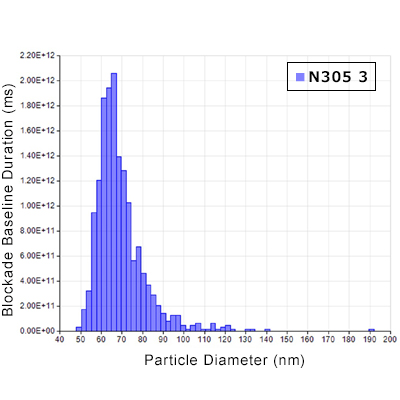
ミルク由来の細胞外小胞測定
Particle diameter (nm)
Mean: 69 ( Std Dev = 12.3 ) / Mode : 66
Maximum : 190 / Minimum : 49
Concentration [40 – 200nm] (particle / ml)
Measured Concentration : 1.57e+11
Row Concentration : 1.57e+13
ミルク由来のエクソソームは、生物学的プロセスおよび食物摂取および健康の相互作用に深い関係があるとされて注目されています。様々な論文で牛乳よりマイクロRNAを体内に取り入れていると発表がされ始めています。
細胞外小胞抽出キット(qEV / qEV single)を使用することで、ミルクからもインタクトな細胞外小胞を15分で抽出することが可能です。同時にExoidで測定することで上記のような高分解能な測定が1時間以内に完了します
ワクチンやウイルスベクターの開発に アデノウイルス測定
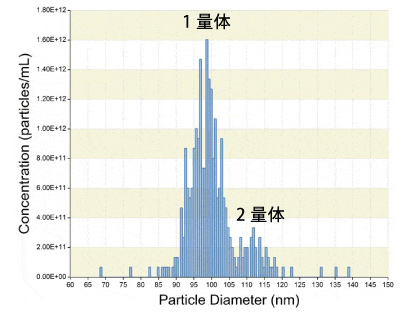
左のグラフはアデノウイルスの測定事例です。 ほとんどがウイルスの粒径を示す90-100nmの範囲にありますが、2つのウイルスがアグリゲーションした110nm付近(単一粒子の体積の2倍に相当)に2つ目のピークが確認できます。
Exoidでは粒子の1量体と2量体を見極める高精度サイズ分布とそれぞれの濃度の定量化ができます。
関連文献
“Quantitative Sizing of Nano/Microparticles with a Tunable Elastomeric Pore Sensor.”
Robert Vogel, Geoff Willmott, Darby Kozak, G. Seth Roberts, Will Anderson, Linda Groenewegen,
Ben Glossop, Anne Barnett, Ali Turner and Matt Trau.
Anal. Chem. 2011, 83, 9, 3499–3506
Publication Date:March 24, 2011
<Abstract>
The use of a “size-tunable” polyurethane resistive pulse sensor for quantitative sizing of nano- and microparticles is presented. A linear relationship, as first suggested by Maxwell, between particle volume and change in electric resistance across the pore was observed. Particle sizes were quantified for a given size-tunable membrane, by first creating a linear calibration curve to a series of monodisperse carboxylated polystyrene particles of various diameters and then applying this curve to calculate the size of “unknown” nanoparticles. The diameters of a selection of synthetic and biological particles, being PMMA and nonfunctionalized polystyrene particles, along with biological nanoparticles (adenovirus) were calculated using this methodology. Calculated particle diameters and coefficients of variation were shown to be in good agreement with both transmission electron microscopy and dynamic light scattering results.
ウイルスや溶存物質との相互作用解析 ナノバクテリア測定
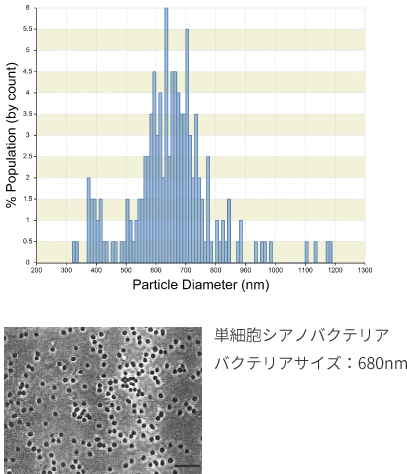
Exoidは最小20mMからのNaCl溶液で測定することが可能です。採取した海水を直接測定する事も可能で、海水中に含まれるウイルスやナノバクテリア、海洋有機物の測定が可能です。
リファレンスカスタマー:
Prof. Penny Chisholm
(Massachusetts Institute of Technology Department of Civil and Enviromental Engineering)
関連文献
“Tunable Pores for Measuring Concentrations of Synthetic and Biological Nanoparticle Dispersions.”
G. Seth Roberts, Sam Yu, Qinglu Zeng, Leslie C.L. Chan, Will Anderson, Aaron H. Colby, Mark W. Grinstaff, Steven Reid, Robert Vogel.
Biosensors and Bioelectronics 31, p. 17-25, Jan 15 (2012).
<Abstract>
Scanning ion occlusion sensing (SIOS), a technique that uses a tunable pore to detect the passage of individual nano-scale objects, is applied here for the rapid, accurate and direct measurement of synthetic and biological nanoparticle concentrations. SIOS is able to characterize smaller particles than other direct count techniques such as flow cytometry or Coulter counters, and the direct count avoids approximations such as those necessary for turbidity measurements. Measurements in a model system of 210-710 nm diameter polystyrene particles demonstrate that the event frequency scales linearly with applied pressure and concentration, and that measured concentrations are independent of particle type and size. Both an external-calibration and a calibration-free measurement method are demonstrated. SIOS is then applied to measure concentrations of Baculovirus occlusion bodies, with a diameter of ~1 μm, and the marine photosynthetic cyanobacterium Prochlorococcus, with a diameter of ~600 nm. The determined concentrations agree well with results from counting with microscopy (a 17% difference between the mean concentrations) and flow cytometry (6% difference between the mean concentrations), respectively.
バクテリアの確認と存在量の比較
バクテリア計測グラフ:サイズ(nm) vs 濃度グラフ(個数/mL)
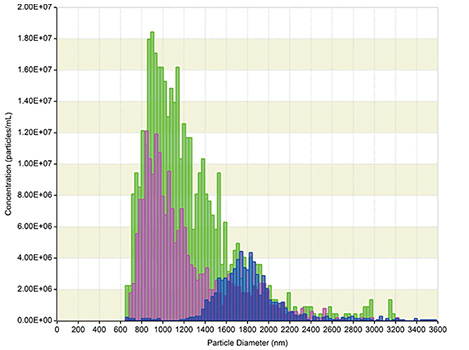
左のグラフはExoidでMethylobacterium sp.(■)とSphingomonas sp.(■)とその混合物(■)をExoidで計測した結果です。
サイズが異なるバクテリアでは、それぞれのバクテリアの存在を高精度のサイズ分布で確認することができます。またその存在を濃度で定量することができ、殺菌剤の開発や共生時の存在比を簡単に計測することができます。
形状の異なるバクテリアの確認 枯草菌と芽胞測定
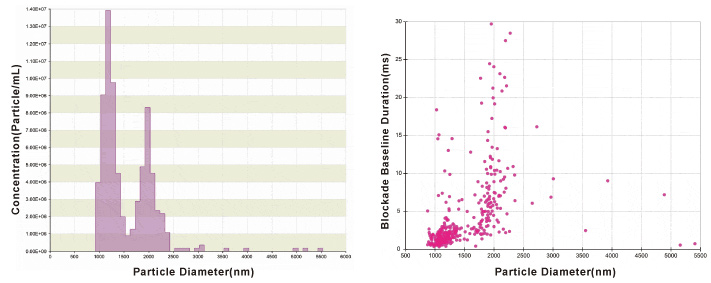
【枯草菌と芽胞の測定】
芽胞は一部の細菌が形作る、極めて耐久性の高い細胞構造です。
上図左側のグラフでは、1.1μm付近に芽胞、2μm付近に枯草菌が見られます。
サイズ(横軸)と通過時間(縦軸)を表した右側のグラフも、それぞれ芽胞と枯草菌が確認できます。
球形に近い芽胞に比べて、円筒形の枯草菌は通過時間にばらつきがあります。これは、ナノポアを通過する際に、円筒形の枯草菌の向きによって通過時間が異なることから見られます。
バイオフィルム形成評価
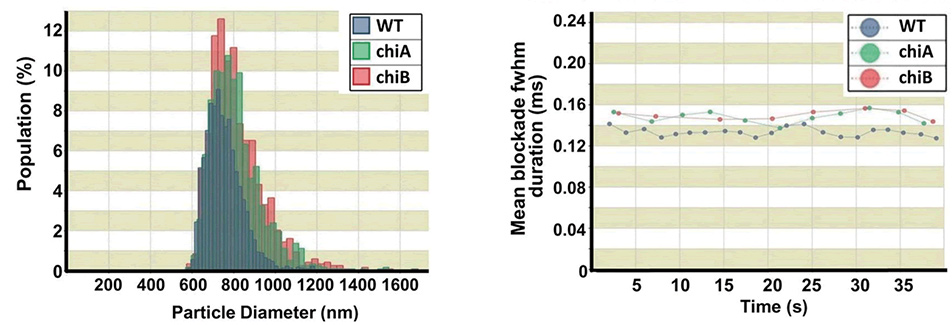
(上図左)バクテリアのサイズ評価 (上図右)表面電荷の評価電気泳動移動度(ms)
Exoidはバクテリアのサイズと高精度濃度計測に加えて、最新の事例でバイオフィルム形成のメカニズム解明とコントロールのために利用されています。バイオフィルムの第一段階は表面への接着です。
バクテリア付着と表面電荷の影響を決定するためにExoidでは表面電荷を電気泳動移動度(ms)から評価することができます。
関連文献
“Chitinases Are Negative Regulators of Francisella novicida Biofilms.”
Chung MC, Dean S, Marakasova ES, Nwabueze AO, van Hoek ML.
PLoS One. 2014 Mar 24;9(3):e93119. doi: 10.1371 / journal.pone. 0093119.
<Abstract>
Biofilms, multicellular communities of bacteria, may be an environmental survival and transmission mechanism of Francisella tularensis. Chitinases of F. tularensis ssp. novicida (Fn) have been suggested to regulate biofilm formation on chitin surfaces. However, the underlying mechanisms of how chitinases may regulate biofilm formation are not fully determined. We hypothesized that Fn chitinase modulates bacterial surface properties resulting in the alteration of biofilm formation. We analyzed biofilm formation under diverse conditions using chitinase mutants and their counterpart parental strain. Substratum surface charges affected biofilm formation and initial attachments. Biophysical analysis of bacterial surfaces confirmed that the chi mutants had a net negative-charge. Lectin binding assays suggest that chitinase cleavage of its substrates could have exposed the concanavalin A-binding epitope. Fn biofilm was sensitive to chitinase, proteinase and DNase, suggesting that Fn biofilm contains exopolysaccharides, proteins and extracellular DNA. Exogenous chitinase increased the drug susceptibility of Fn biofilms to gentamicin while decreasing the amount of biofilm. In addition, chitinase modulated bacterial adhesion and invasion of A549 and J774A.1 cells as well as intracellular bacterial replication. Our results support a key role of the chitinase(s) in biofilm formation through modulation of the bacterial surface properties. Our findings position chitinase as a potential anti-biofilm enzyme in Francisella species.
食品の評価 牛乳と加工乳の比較
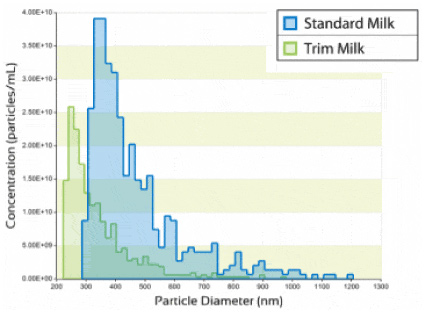
標準的なミルク(青棒)にはカゼインミセルやラクトース、脂肪球などが含まれており、幅広い粒度分布を示します。
加工ミルク(緑棒)には粒子サイズが大きい成分が少ないことがわかります。しかし標準的なミルクのピークに近いところにピークを確認することができることから、ミルクの主成である脂質球が含まれていることが推測できます。
コアシェルナノ粒子の測定
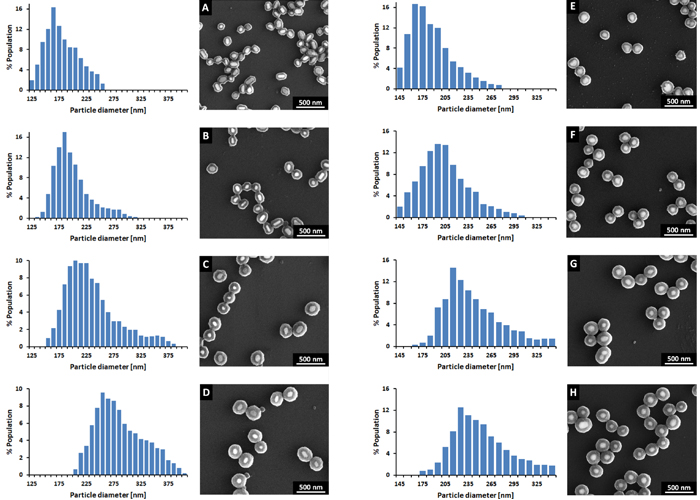
コアシェルナノ粒子は、2種の材料でナノ粒子を作成する技術で、コアのサイズ、形状、厚みなどから粒子自体に様々な特性を持たせることが出来る為、触媒など様々な分野での応用が期待されています。
一般的に粒子のサイズ測定でDLSが使用されていますが、光を使用した測定の為、DLSではサンプルの色や形状により、測定結果に影響を受けてしまいます。特にコアシェルナノ粒子は、屈折率が異なる2個の材料からできている為、DLSでの測定は非常に困難です。
上記グラフは金ナノ粒子と銀ナノ粒子をTiO2でコーティングしたコアシェルナノ粒子です。ExoidのTRPS法であれば光学や形状にかかわらず1粒子ごとのサイズを高分解能に測定することが出来ています。
関連文献
“Synthesis and characterization of noble metal–titania core–shell nanostructures with tunable shell thickness.“
Bartosz Bartosewicz, Marta Michalska-Domańska, Malwina Liszewska, Dariusz Zasada and
Bartłomiej J. Jankiewicz
Beilstein J. Nanotechnol. 2017, 8, 2083–2093. doi:10.3762/bjnano.8.208
<Abstract>
Core–shell nanostructures have found applications in many fields, including surface enhanced spectroscopy, catalysis and solar cells. Titania-coated noble metal nanoparticles, which combine the surface plasmon resonance properties of the core and the photoactivity of the shell, have great potential for these applications. However, the controllable synthesis of such nanostructures remains a challenge due to the high reactivity of titania precursors. Hence, a simple titania coating method that would allow better control over the shell formation is desired. A sol–gel based titania coating method, which allows control over the shell thickness, was developed and applied to the synthesis of Ag@TiO2 and Au@TiO2 with various shell thicknesses. The morphology of the synthesized structures was investigated using scanning electron microscopy (SEM). Their sizes and shell thicknesses were determined using tunable resistive pulse sensing (TRPS) technique. The optical properties of the synthesized structures were characterized using UV–vis spectroscopy. Ag@TiO2 and Au@TiO2 structures with shell thickness in the range of ≈40–70 nm and 90 nm, for the Ag and Au nanostructures respectively, were prepared using a method we developed and adapted, consisting of a change in the titania precursor concentration. The synthesized nanostructures exhibited significant absorption in the UV–vis range. The TRPS technique was shown to be a very useful tool for the characterization of metal–metal oxide core–shell nanostructures.
顔料の評価 色素の分散比較
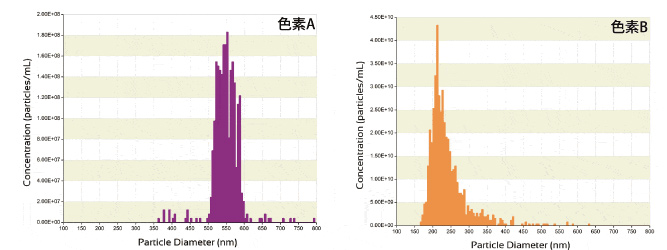
2種類の色素の測定評価の結果です。
色素Aは550nm付近、色素Bは220nm付近にピーク値が存在します。2つの色素でサイズ分布とサイズ毎の濃度に大きな違いがあることがわかります。
水道水の測定 低濃度サンプルでも高精度に測定
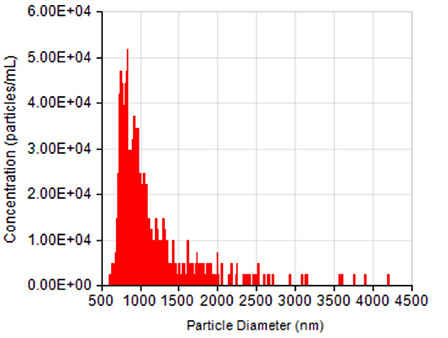
水道水をExoidで測定を行ったデータです。
低濃度のサンプルも高分解能で測定することが出来ます。
フィルタリング前後での粒度分布・サイズ毎の濃度数の変化も正確にご評価頂けます。
In situで粒子間の相互作用をリアルタイムモニタリング
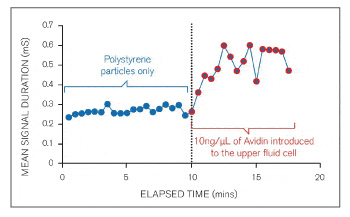
高分子粒子とタンパク質の相互作用測定
ナノポアを粒子が通過する時間はチャージ量によって変化します。この変化量を見る事で、粒子と粒子の相互作用を測定します。
左図は、マイナス電荷のカルボキシル化ポリスチレン粒子の計測10分後にプラス電荷のアビジンを滴下した時のナノポア通過時間を計測したグラフです。アビジンの吸着により、通過時間が長くなった事を示しています。
ポリスチレンとアビジンが結合していることがわかります。
関連文献
“Resistive Pulse Sensing of Analyte-Induced Multicomponent Rod Aggregation Using Tunable Pores”
Platt, M., Willmott, G. R. and Lee, G. U.
Small. doi: 10.1002/smll.201200058, Published Online: May9, (2012)
<Abstract>
Resistive pulse sensing is used to monitor individual and aggregated rod-shaped nanoparticles as they move through tunable pores in elastomeric membranes. By comparing particles of similar dimensions, it is demonstrated that the resistive pulse signal of a rod is fundamentally different from that of a sphere. Rods can be distinguished using two measurements: the blockade event magnitude (Δi(p) ), which reveals the particle’s size, and the full width at half maximum (FWHM) duration, which relates to the particle’s speed and length. While the observed Δi(p) values agree well with simulations, the measured FWHM times are much larger than expected. This increase in dwell time, caused by rods moving through the pore in various orientations, is not observed for spherical particles. These differences are exploited in a new agglutination assay using rod-shaped particles. By controlling the surface chemistry and location of the capture ligand, rods are made to form either long “end-on-end” or wide “side-on” aggregates upon the addition of an analyte. This observation will facilitate multiplexed detection in agglutination assays, as particles with a particular aspect ratio can be distinguished by two measurements. This is first demonstrated with a biotinylated target and avidin capture probe, followed by the detection of platelet-derived growth factor (PDGF-BB) using an aptamer capture probe, with limits of detection down to femtomolar levels.

